
Digital Agency Gibraltar Blog
Statistics on Search Engine Marketing usage and adoption to inform your search engine marketing strategies and tactics
Statistics help us turn data into information, allowing us to make informed and rational decisions and that’s exactly the purpose of this article. We’re huge fans of search engine marketing, but not everyone believes in its potential for growing a business, either through Search Engine Optimisation or Paid Search Marketing – which means an AdWords focus in many countries.
This article is aimed at helping you make better-informed decisions about the running of your search marketing and making the business case by modelling the returns from Search Engine Marketing if you’re using a search gap analysis to put a quantitative estimate to the returns. Questions we answer in this article include:
- What is the overall volume of search?
- What is the market share of search in different search engines
- Importance of mobile seaches vs desktop searches by industry category
- Clickthrough rate on the SERPs by position
- Clickthrough rates on AdWords by position
What is a Search Engine?
First of all, I thought it would make sense to define what a search engine is, as the EU managed to mess this up quite monumentally. The most realistic definition for me is from Webopedia – who state…
“Search engines are programs that search documents for specified keywords and returns a list of the documents where the keywords were found. A search engine is really a general class of programs, however, the term is often used to specifically describe systems like Google, Bing and Yahoo! Search that enables users to search for documents on the World Wide Web.”
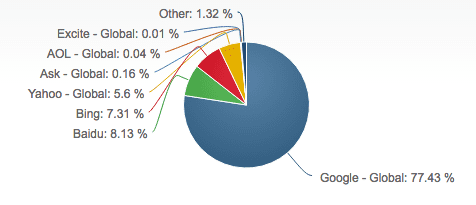
Who has the biggest search engine market share worldwide?
According to Net Market Share (as of April 2017) the global marketing share percentage, in terms of the use of Search Engines heavily favours Google, with over 77%. This again reinforces that fact that Google are the market leaders, however it also highlights that the “Others” such as Yahoo, Bing and Baidu etc still hold a large audience and it would be silly to simply ignore them. It’s interesting to note that Google’s large market share is still on the increase. Last year we saw a 67% market share for Google, so Google has taken another 10% of the market from its rivals in just the past 12 months.
How many searches are made each day?
The number of people using internet search engines is increasing year on year and is almost unfathomable. At…
6,586,013,574 searches a day worldwide
Which in “word-terms” equates to six billion, five hundred eighty-six million,
thirteen thousand, five hundred and seventy-four.
To put it into perspective there are on average around 500million tweets per day, so 500million X 13.
Breaking this down using the above Market Share chart and the data from Internet live stats, below you’ll find the number of daily searches per Search Engine.
Search Engine |
Searches per day |
| 4,464,000,000 | |
| Bing | 873,964,000 |
| Baidu | 583,520,803 |
| Yahoo | 536,101,505 |
| Other (AOL, Ask etc) | 128,427,264 |
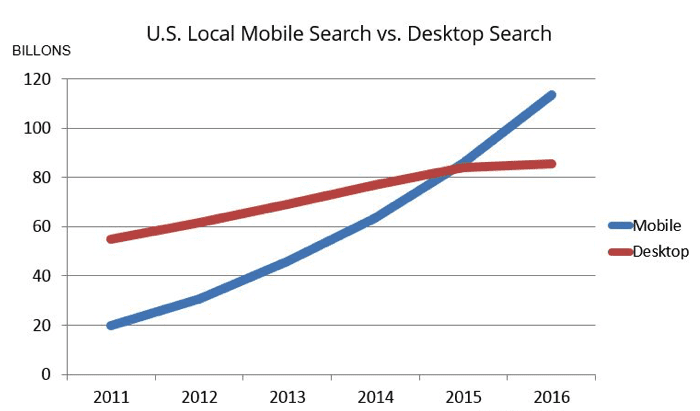
How many searches are made on Desktop vs Mobile vs Tablet?
It was several years ago now that Google announced that we had passed the tipping point whereby the number of Mobile searches had taken over that of Desktop stating…
“more Google searches take place on mobile devices than on computers in 10 countries including the US and Japan.”
The graph below highlights the rate at which Mobile has surpassed Desktop search, specifically in this instance in the form of Local Search i.e. users searching for local businesses.
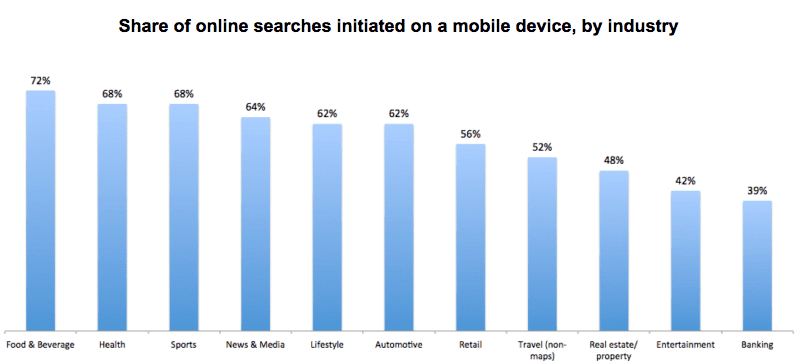
If you want to do a little further reading into this Natalie Nahai has does a really detailed analysis. The chart below breaks down the percentage of searches carried out on a mobile device across different industries. It’s intestting to see how high the variance is, with mobile food searches occouring at almost double the rate of mobile searches for banking.
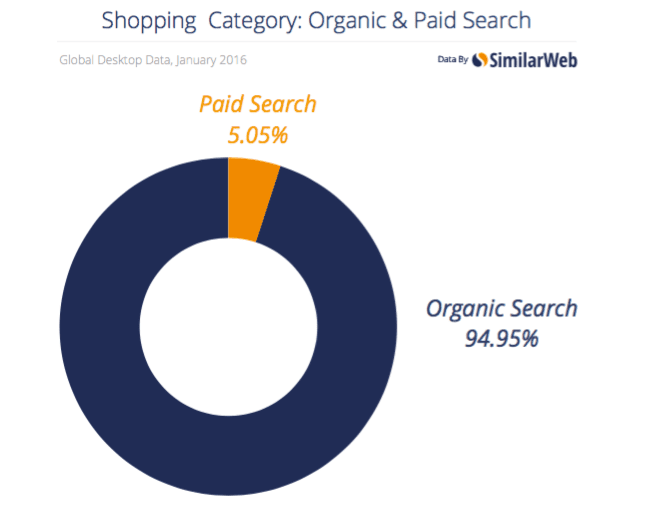
Percentage clicking on Paid vs Organic results?
The Similar Web Search Report offers some great insights into the state of Paid vs Organic. Paid search equates for just over 5% of all traffic, with organic hovering around the 95% mark. Unfortunately, this dataset doesn’t include mobile, where I suspect there would be a shift towards paid, due to the above the fold nature of mobile.
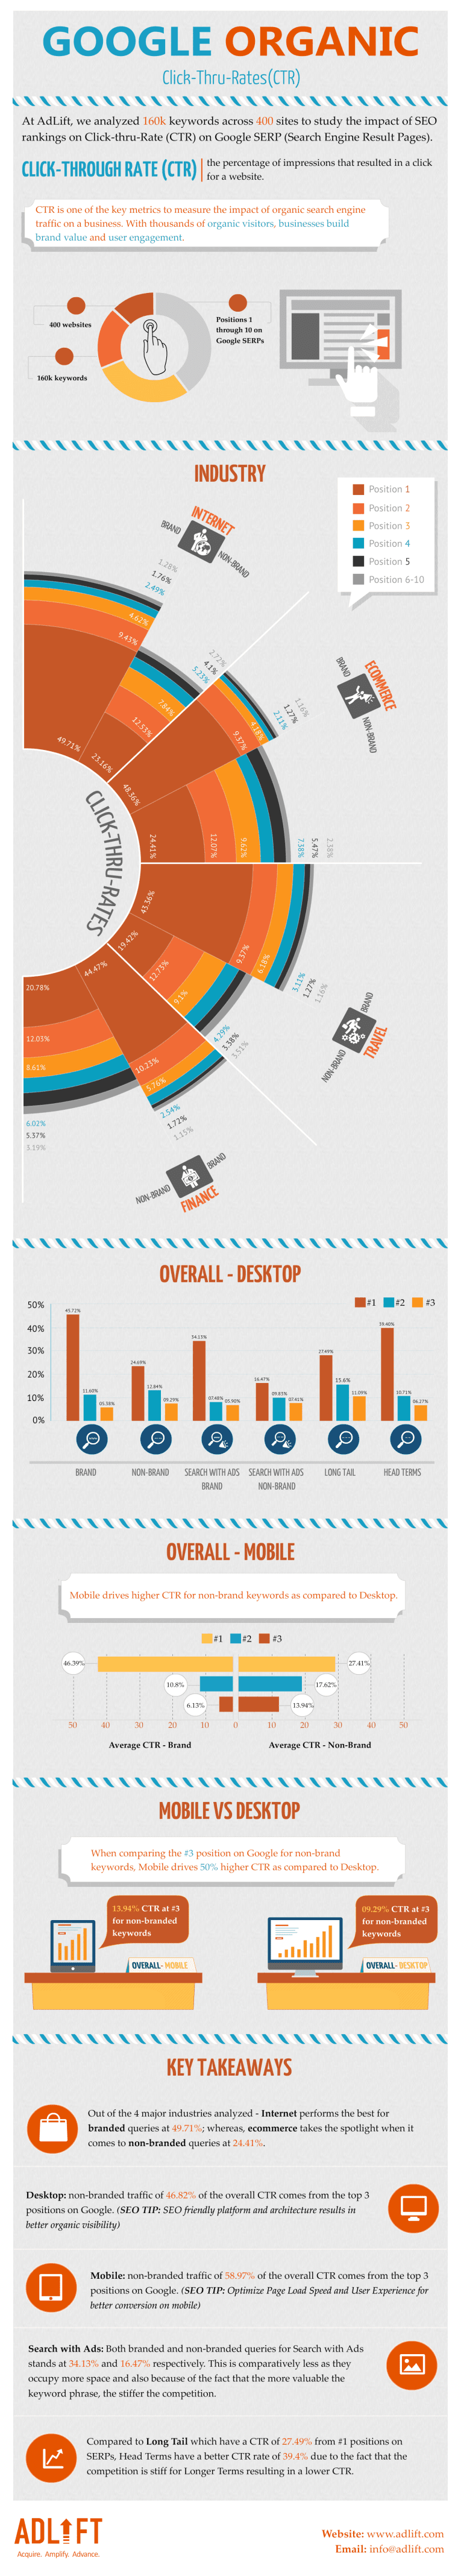
Percentage click through rate (CTR) of branded vs non-branded keywords?
This is a question we get asked a lot and is something which does vary case to case. However, the team over at Adlift recently created the below infographic, which does a good job of giving you a benchmark/indicator of how branded vs non-branded keywords perform.
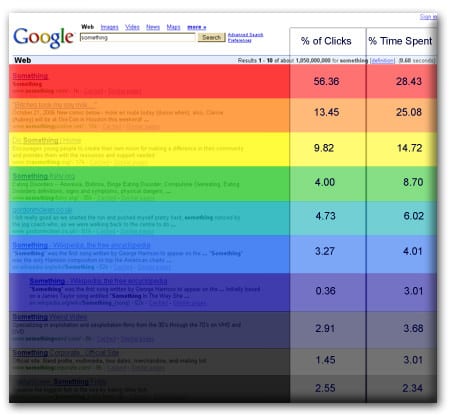
Do click through rate (CTR) declines based on position?
Looking first at Adwords, the CTR varies greatly between positions, we actually covered this a little while ago, in a post by Farhad Divecha. Please note that since this data was used, there have been updates to the SERPs, and Ad’s have now been removed from the right side, if you want to read more about this and the effects it has had, read this post.

The graph above highlights the importance of being in position 1. With a 7.11% CTR this is vastly better than the 3.01% in position 2 and 2.19% in position 3. This is not to say don’t try and occupy positions 2,3,4 etc as the cost of being in P1 might outweigh the ROI of lower positions.
The CTR tends to be higher on organic results and higher the further up the page you are, please note that we’re talking about pg. 1 of SERP. If you find your site on pg. 2 of the results, you’re looking at figures closer to the 1 in every 1000 and this is entirely dependant on whether the keyword has over 10,000 monthly searches.
Click through rates (CTR) for PPC per Industries
Wordstream have produced a set of infographics based on averages across AdWords metrics such as Average CTR, Cost-per-click (CPC), average conversion rate (CVR) and cost per action (CPA) across twenty industries.
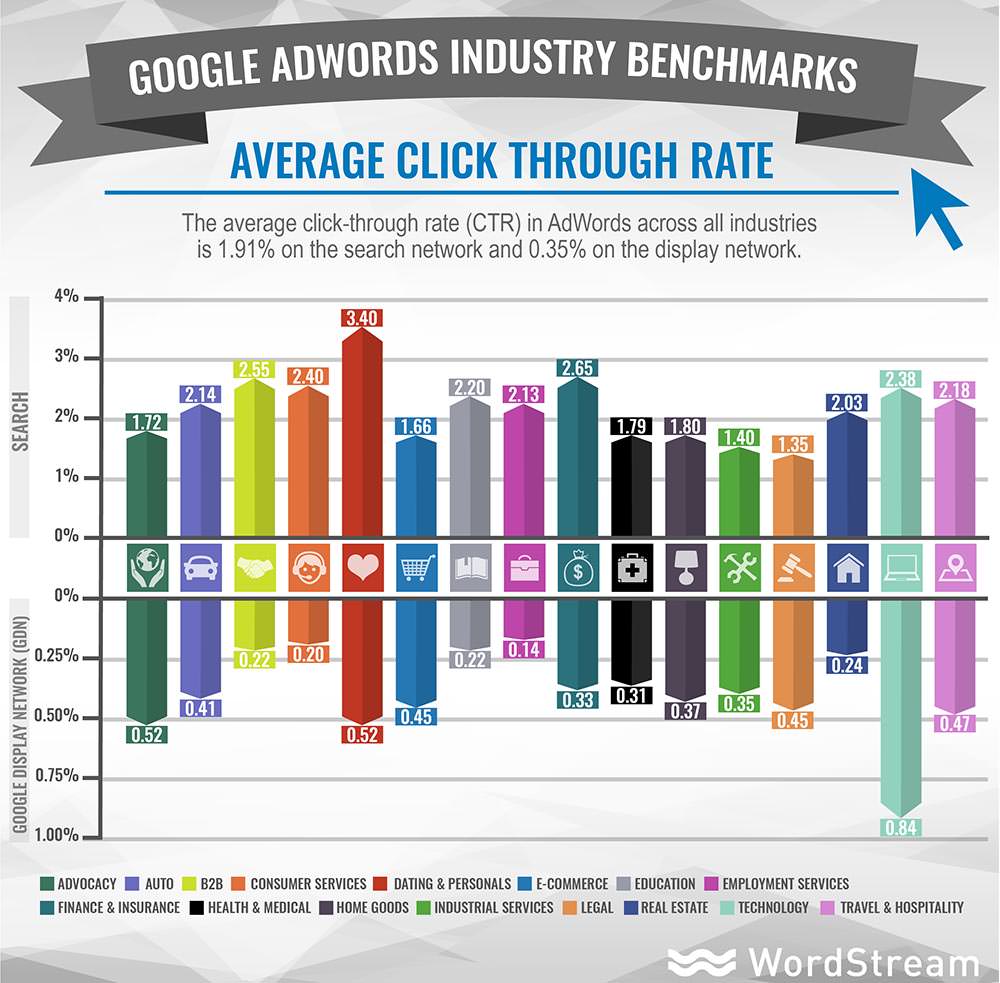
It shows the dating world is head and shoulders above the rest (3.4%), with other high-fliers including Finance (2.65%), B2B (2.55%), Consumer Services (2.40%), and Technology (2.38%).
Some of the industries flagging a little include the likes of Legal Services (1.35% CTR), eCommerce (1.66%) and industrial services (1.40%). It’s interesting to see eCommerce so low down on the CTR, however, this could be to do with the amount competition and the sheer number of eCommerce stores set-up poorly.
The ADI discovered that the Click Through Rate (CTR) on search have increased YoY, with the top 20% pulling away from other industries, except in the financial services where they are making ground on the industries above. If you’re in finance, it’s time to get on board with PPC, there appears to be a big push with paid ads.
The next infographic produced by Wordstream gives the average conversion rate.
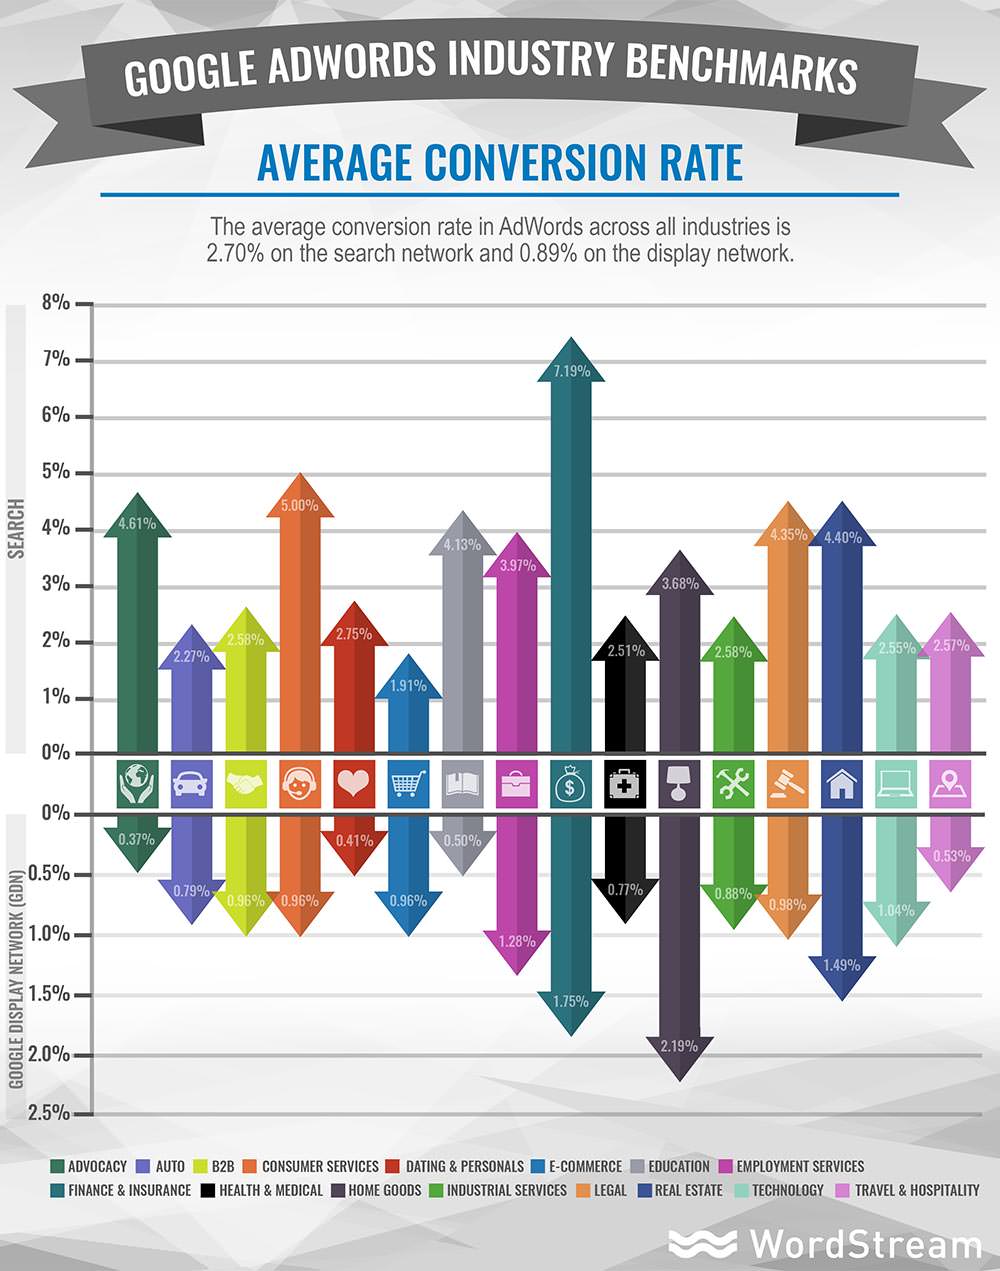
Interestingly, it’s the finance and insurance industry which convert the best, with a whopping 7.19% CVR, making sense of the sudden surge of interest in PPC in the Financial industry.
If there are any more statistics you’d like to find out, let us know in the comments below and we’ll let you know the answers – we know all the best sources.
By Robert Allen
I am the Editor of Smart Insights. I manage the Smart Insights blog and write on a range of subjects- Marketing Technology trends and latest tech developments are a regular focus, as well as exploring key marketing concepts. You can get in touch with me on Twitter and connect with me on LinkedIn.
SEO is a pet subject of mine
Google have issued a lot of updates recently, Penguin, Panda and lately the most recent addition by Matt Cutts is the disavow tool
Here is his video to explain it
Read more : Digital Agency Gibraltar Blog Business Insider story
How does Google work ? Cool infographic about SEO
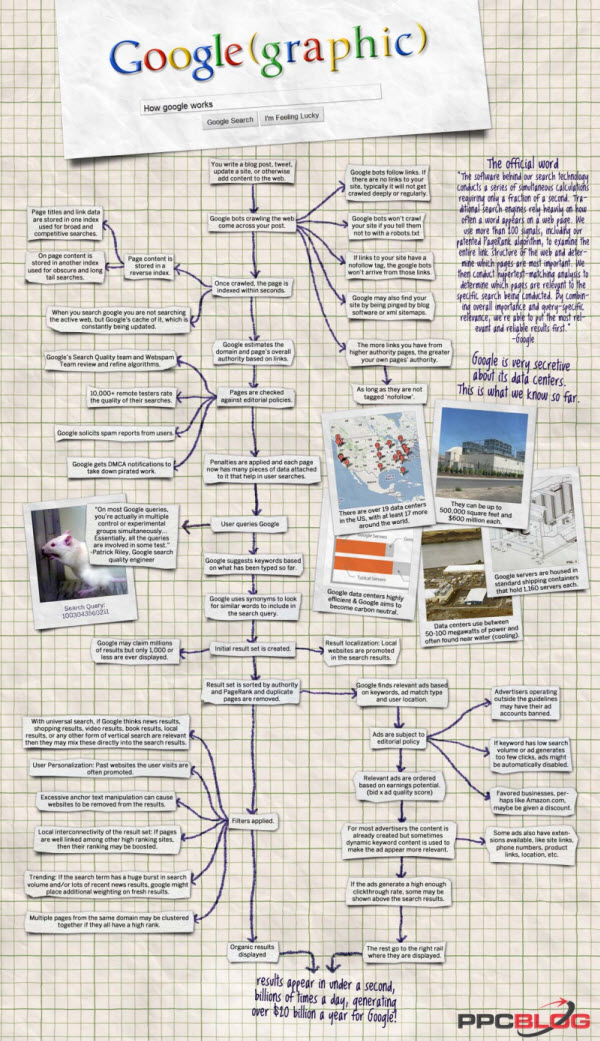
Infographic by the Pay Per Click Blog
Infographic by PPCBlog
Mobile Apps
Theres a very big industry selling and creating mobile apps, DAG is in the process of learning this, if anyone is interested get in touch
Digital Agency Gibraltar Blog